The Silent Killer of Construction Margins
Let’s be blunt: most contractors don’t know exactly where their margins are fading. Sure, you might have a rough idea — material costs went up, labor took more time than expected, or a subcontractor overshot their budget. But when you add it all up, the math doesn’t lie. Profits erode, and projects that seemed solid on paper become financial headaches.
A McKinsey report found that large construction projects typically run 80% over budget and take 20% longer than planned. For small to mid-size contractors in India and GCC, even a 5% margin fade can make or break a project. This is where structured tools like the BOQ Margin Report come in — a feature in platforms like JobNext that’s designed to dissect your margins before they bleed out.
What’s Eating Your Margins?
From our experience tracking over 150 construction projects, margin erosion often boils down to three culprits:
1. Estimation Errors
Your initial BOQ rates didn’t reflect real-world costs. Maybe you underquoted labor or didn’t account for price volatility in materials. For instance, in 2022, steel prices surged by 30% globally due to supply chain disruptions and geopolitical tensions. Contractors who didn’t anticipate this found themselves absorbing significant losses.
2. Procurement Overruns
Late purchase orders and missing rate contracts lead to inflated costs. Vendors know when you’re desperate. A contractor in Bangalore reported that an urgent material order for cement cost them ₹3 lakh extra because they didn’t lock in rates beforehand.
3. Scope Changes
Client-driven changes mid-project often go undocumented or underbilled, leaving you to absorb the cost. For example, a residential developer in Dubai added premium fixtures to a project without updating the BOQ. The contractor absorbed ₹5 lakh in losses because the change wasn’t formalized.
Why Real-Time Tools Matter
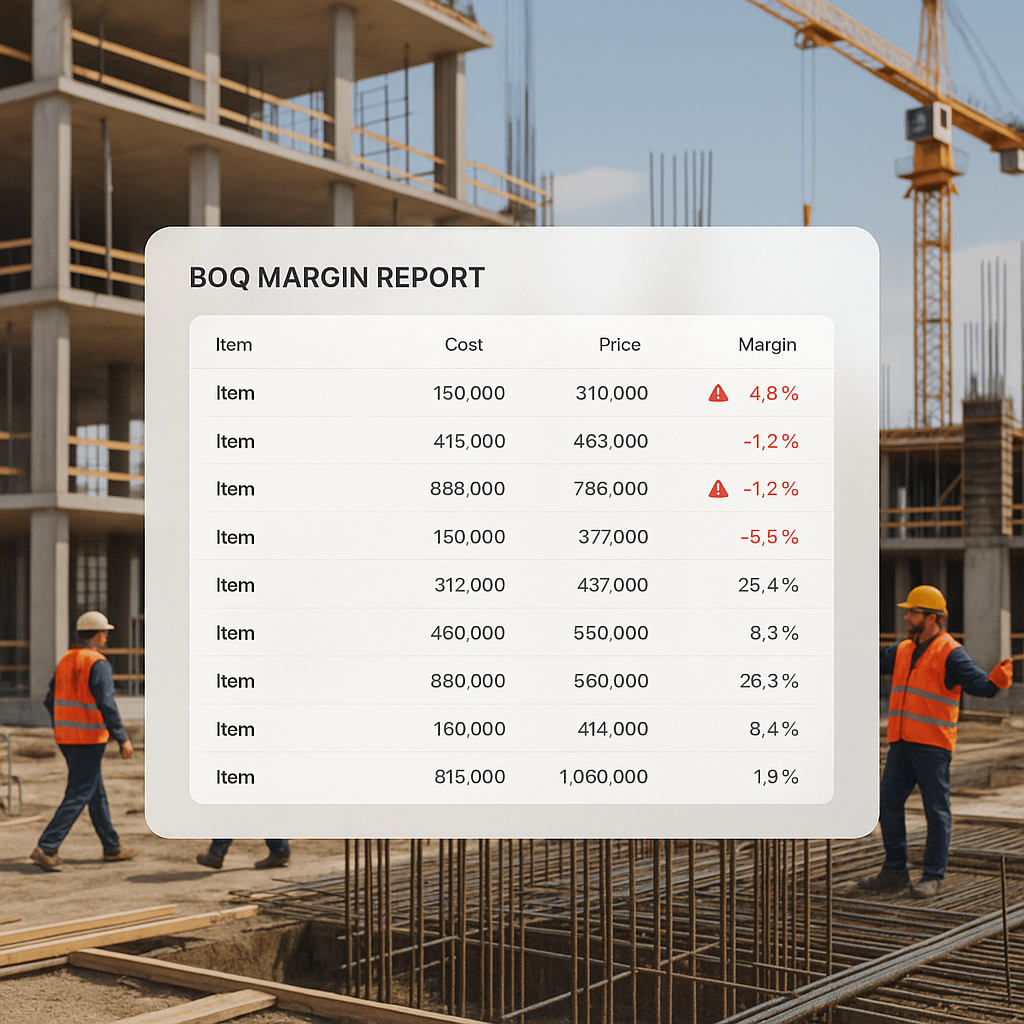
The solution? Stop looking at project profitability in hindsight. Use tools that track margins in real-time and flag issues weekly. The BOQ Margin Report is one such tool that breaks down profitability by BOQ item, comparing contracted values against actual costs for labor, materials, subcontractors, machinery, and overheads.
How the BOQ Margin Report Works (And Why It’s Essential)
The BOQ Margin Report isn’t just another spreadsheet dump. It’s your early warning system. Here’s what it does:
Key Features
- Profitability Analysis: It compares your contracted BOQ rates to actual costs across five resource types: material, labor, machines, subcontractors, and overheads.
- Variance Detection: Items showing negative margins get flagged immediately. These could indicate estimation errors, scope changes, or procurement inefficiencies.
- Actionable Insights: Drill down into flagged BOQs to identify specific cost drivers. Is it a vendor overcharging? A subcontractor underperforming? Or just poor initial budgeting?
Case Study: Catching a ₹12 Lakh Overrun Early
One EPC contractor we worked with in Oman faced a recurring issue: their projects consistently overshot budgets by 15-20%. When they started using JobNext’s BOQ Margin Report, they uncovered a ₹12 lakh overrun caused by a single vendor charging inflated rates for structural steel. By flagging this in Week 3 instead of Month 6, they renegotiated the contract and clawed back ₹8 lakh in savings.
The lesson? Don’t wait until the project close-out to reconcile your costs. Use real-time data to act while there’s still room to maneuver.
Best Practices for Accurate Margin Analysis
Here’s how you can make margin tracking a routine (and effective) part of your project management:
1. Run Weekly Reports
Make the BOQ Margin Report a non-negotiable part of your weekly review meetings. Regular reviews ensure you catch issues before they spiral out of control.
2. Combine with Other Metrics
Use the BOQ Progress and Resource Reconciliation reports alongside the Margin Report. Together, they give a 360° view of cost, schedule, and budget health.
3. Automate Data Collection
Manual entry is prone to errors and delay. Use platforms like JobNext to automate data from purchase orders, invoices, and timesheets. This reduces human error and saves valuable time.
4. Standardize Processes
Create a formal workflow for documenting scope changes, rate negotiations, and vendor evaluations. For example, one UAE-based contractor introduced a change order tracker that flagged undocumented scope changes within 24 hours.
5. Train Your Team
A tool is only as good as the people using it. Train your project managers and accountants to interpret margin data and act on it. In one Mumbai firm, team training reduced margin fade by 7% across five projects.
Real-World Examples
Example 1: Vendor Negotiations Saved ₹5 Lakh
A contractor working on a commercial high-rise in Chennai used the BOQ Margin Report to identify inflated rates for finishing materials. Early flagging allowed them to renegotiate with the vendor and save ₹5 lakh before procurement began.
Example 2: Labor Cost Adjustments Prevented Overruns
In Pune, a residential developer realized their labor costs were exceeding estimates by ₹2 lakh midway through the project. Using real-time margin tracking, they optimized work schedules and shifted tasks to subcontractors, recovering ₹1.5 lakh.
Addressing Skepticism: “But My Margins Are Fine”
You might think weekly reviews are overkill. After all, margins in construction are already razor-thin. But ask yourself: can you afford to lose another 1-2% per project? That’s the difference between breaking even and making a profit.
And if you’re still relying on spreadsheets or siloed systems, you’re probably missing the full picture. As this article points out, disconnected systems are a major reason why contractors fail to catch margin erosion in time.
Comparison Table: Manual Tracking vs. Automated BOQ Margin Reports
| Feature | Manual Tracking | Automated Tools (e.g., JobNext) |
|---|---|---|
| Data Accuracy | Prone to errors | High accuracy |
| Frequency of Reviews | Monthly or quarterly | Weekly |
| Time Investment | High (manual entry) | Low (automated collection) |
| Scope Change Documentation | Often missed | Integrated |
| Cost Savings | Limited | Significant |
FAQ
1. How often should I review the BOQ Margin Report?
Weekly. This ensures you catch issues before they spiral out of control.
2. What’s the biggest cause of negative margins in BOQ items?
Typically, it’s a mix of estimation errors and procurement overruns. Late or overpriced material orders are a common culprit.
3. Can I integrate BOQ margin tracking with other systems?
Yes. Tools like JobNext integrate procurement, billing, and cost tracking into a unified platform, so you’re not chasing data across spreadsheets.
4. What’s the ROI on using JobNext for margin tracking?
While it varies, contractors have reported saving lakhs per project by catching overruns early. One case study flagged a ₹12 lakh overrun and recovered ₹8 lakh.
5. Does this work for small contractors, too?
Absolutely. In fact, smaller contractors have less margin for error, making this even more critical.
Ready to Stop Losing Margins?
If you’re dealing with margin erosion or struggling with disconnected systems, JobNext can help. Explore the platform →
Learn more at JobNext.ai